E-commerce
Revolutionizing e-commerce testing with QALIPSIS
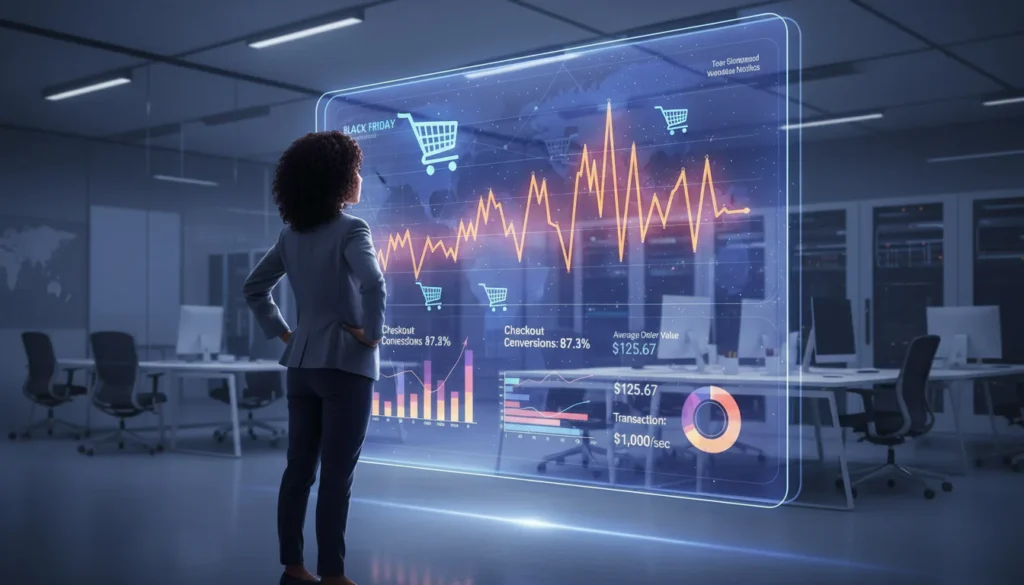
What breaks in your order pipeline when Black Friday traffic hits?
Can your IoT platform detect degradation before your customers do?
A leading provider of IoT and telematics solutions, specialising in fleet management, asset tracking, and connected devices. Their microservice-based platform processes vast amounts of data from IoT devices worldwide.
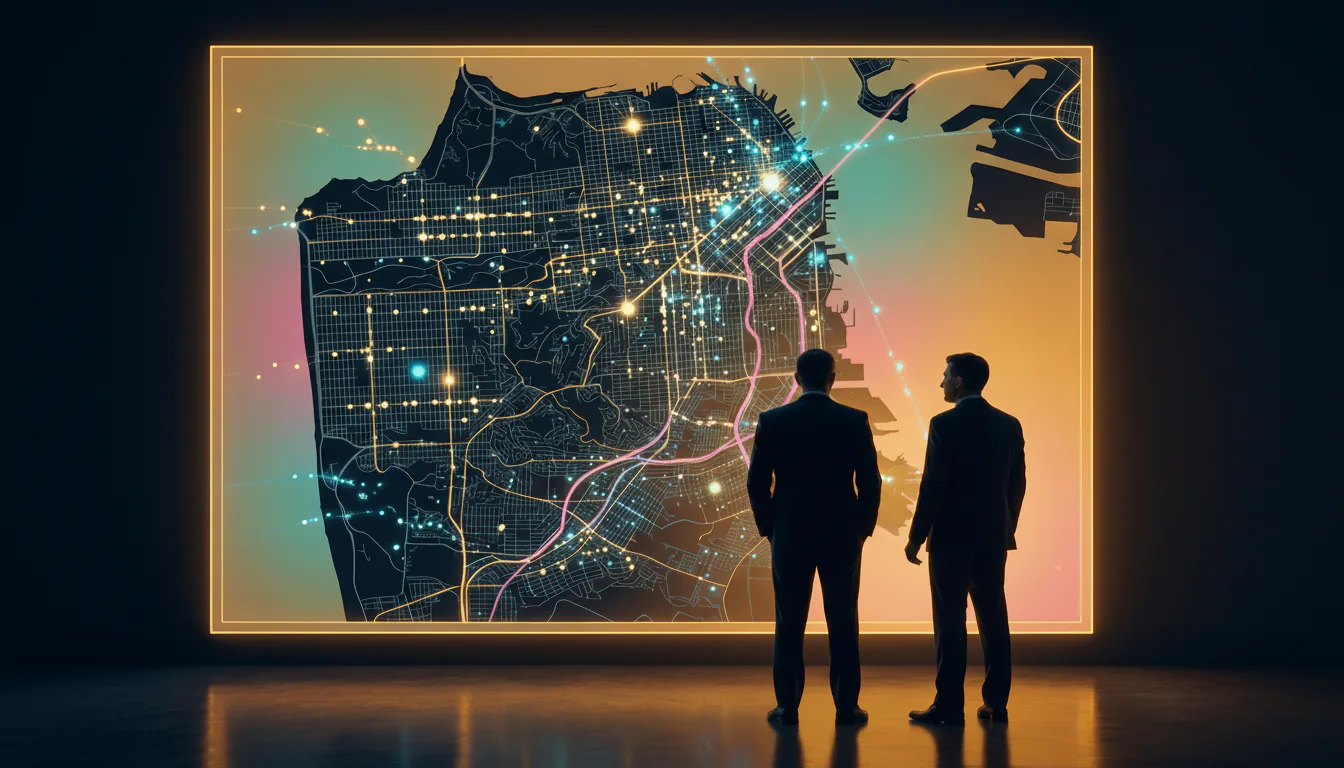
Proprietary TCP/UDP device connectors, Apache Kafka (event backbone), Elasticsearch (device state and analytics)
Long-running campaigns in standalone mode for continuous production monitoring


What breaks in your order pipeline when Black Friday traffic hits?

Why do playback failures spike when the CDN still has headroom?
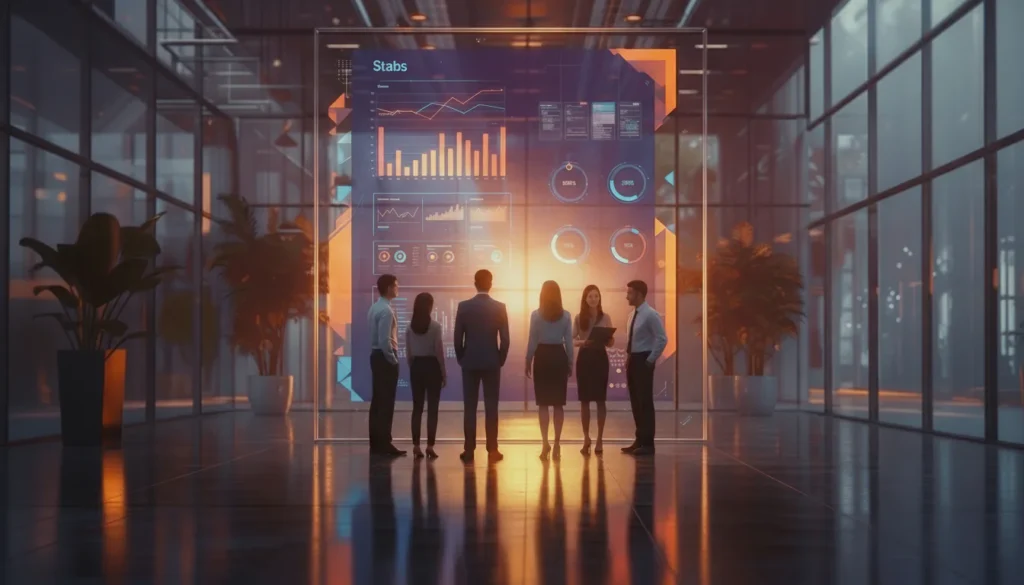
What if every pull request caught performance regressions automatically?