Reports
A report aggregates one or more series over a set of campaigns and renders them as charts and tables. Reports are re-usable: once defined, the same layout can be regenerated against different campaigns and downloaded as PDF.
Reports list
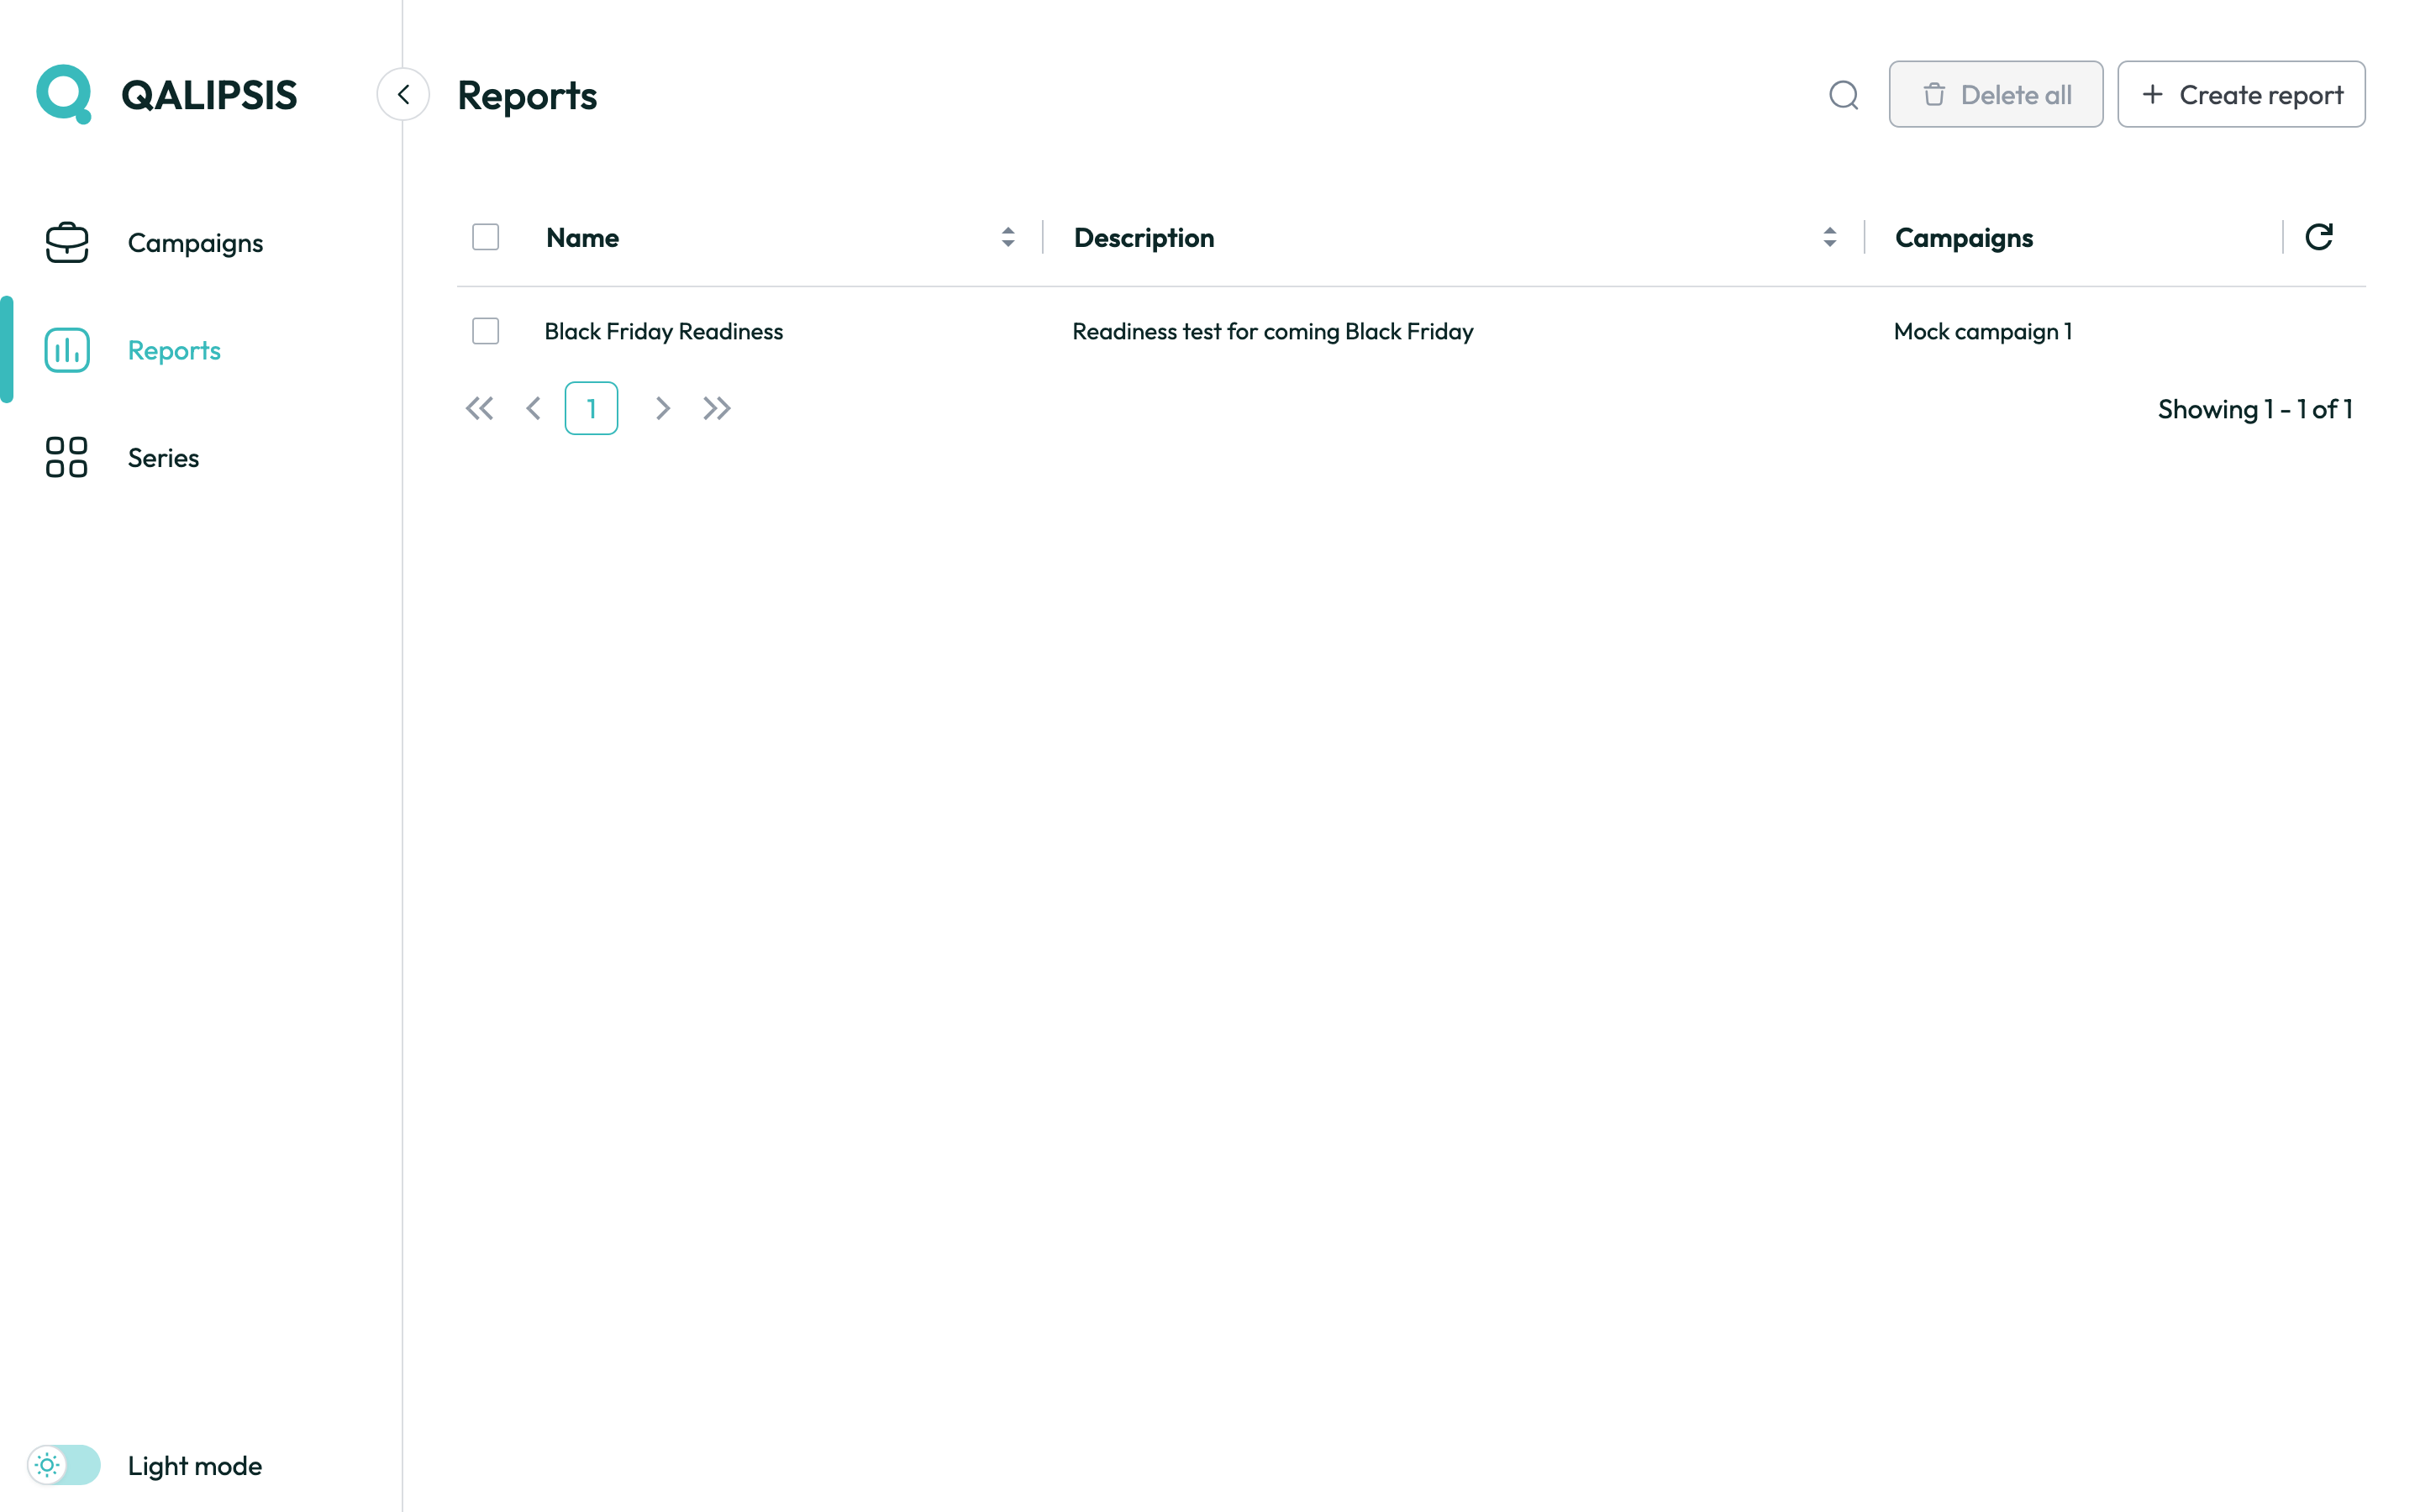
Each row shows:
-
Display name.
-
Description.
-
Referenced campaigns — number of campaigns currently attached.
The header exposes the New report action, a deletion action and a filter. Hovering a row reveals the edit action, which opens the report details screen.
Creating a report
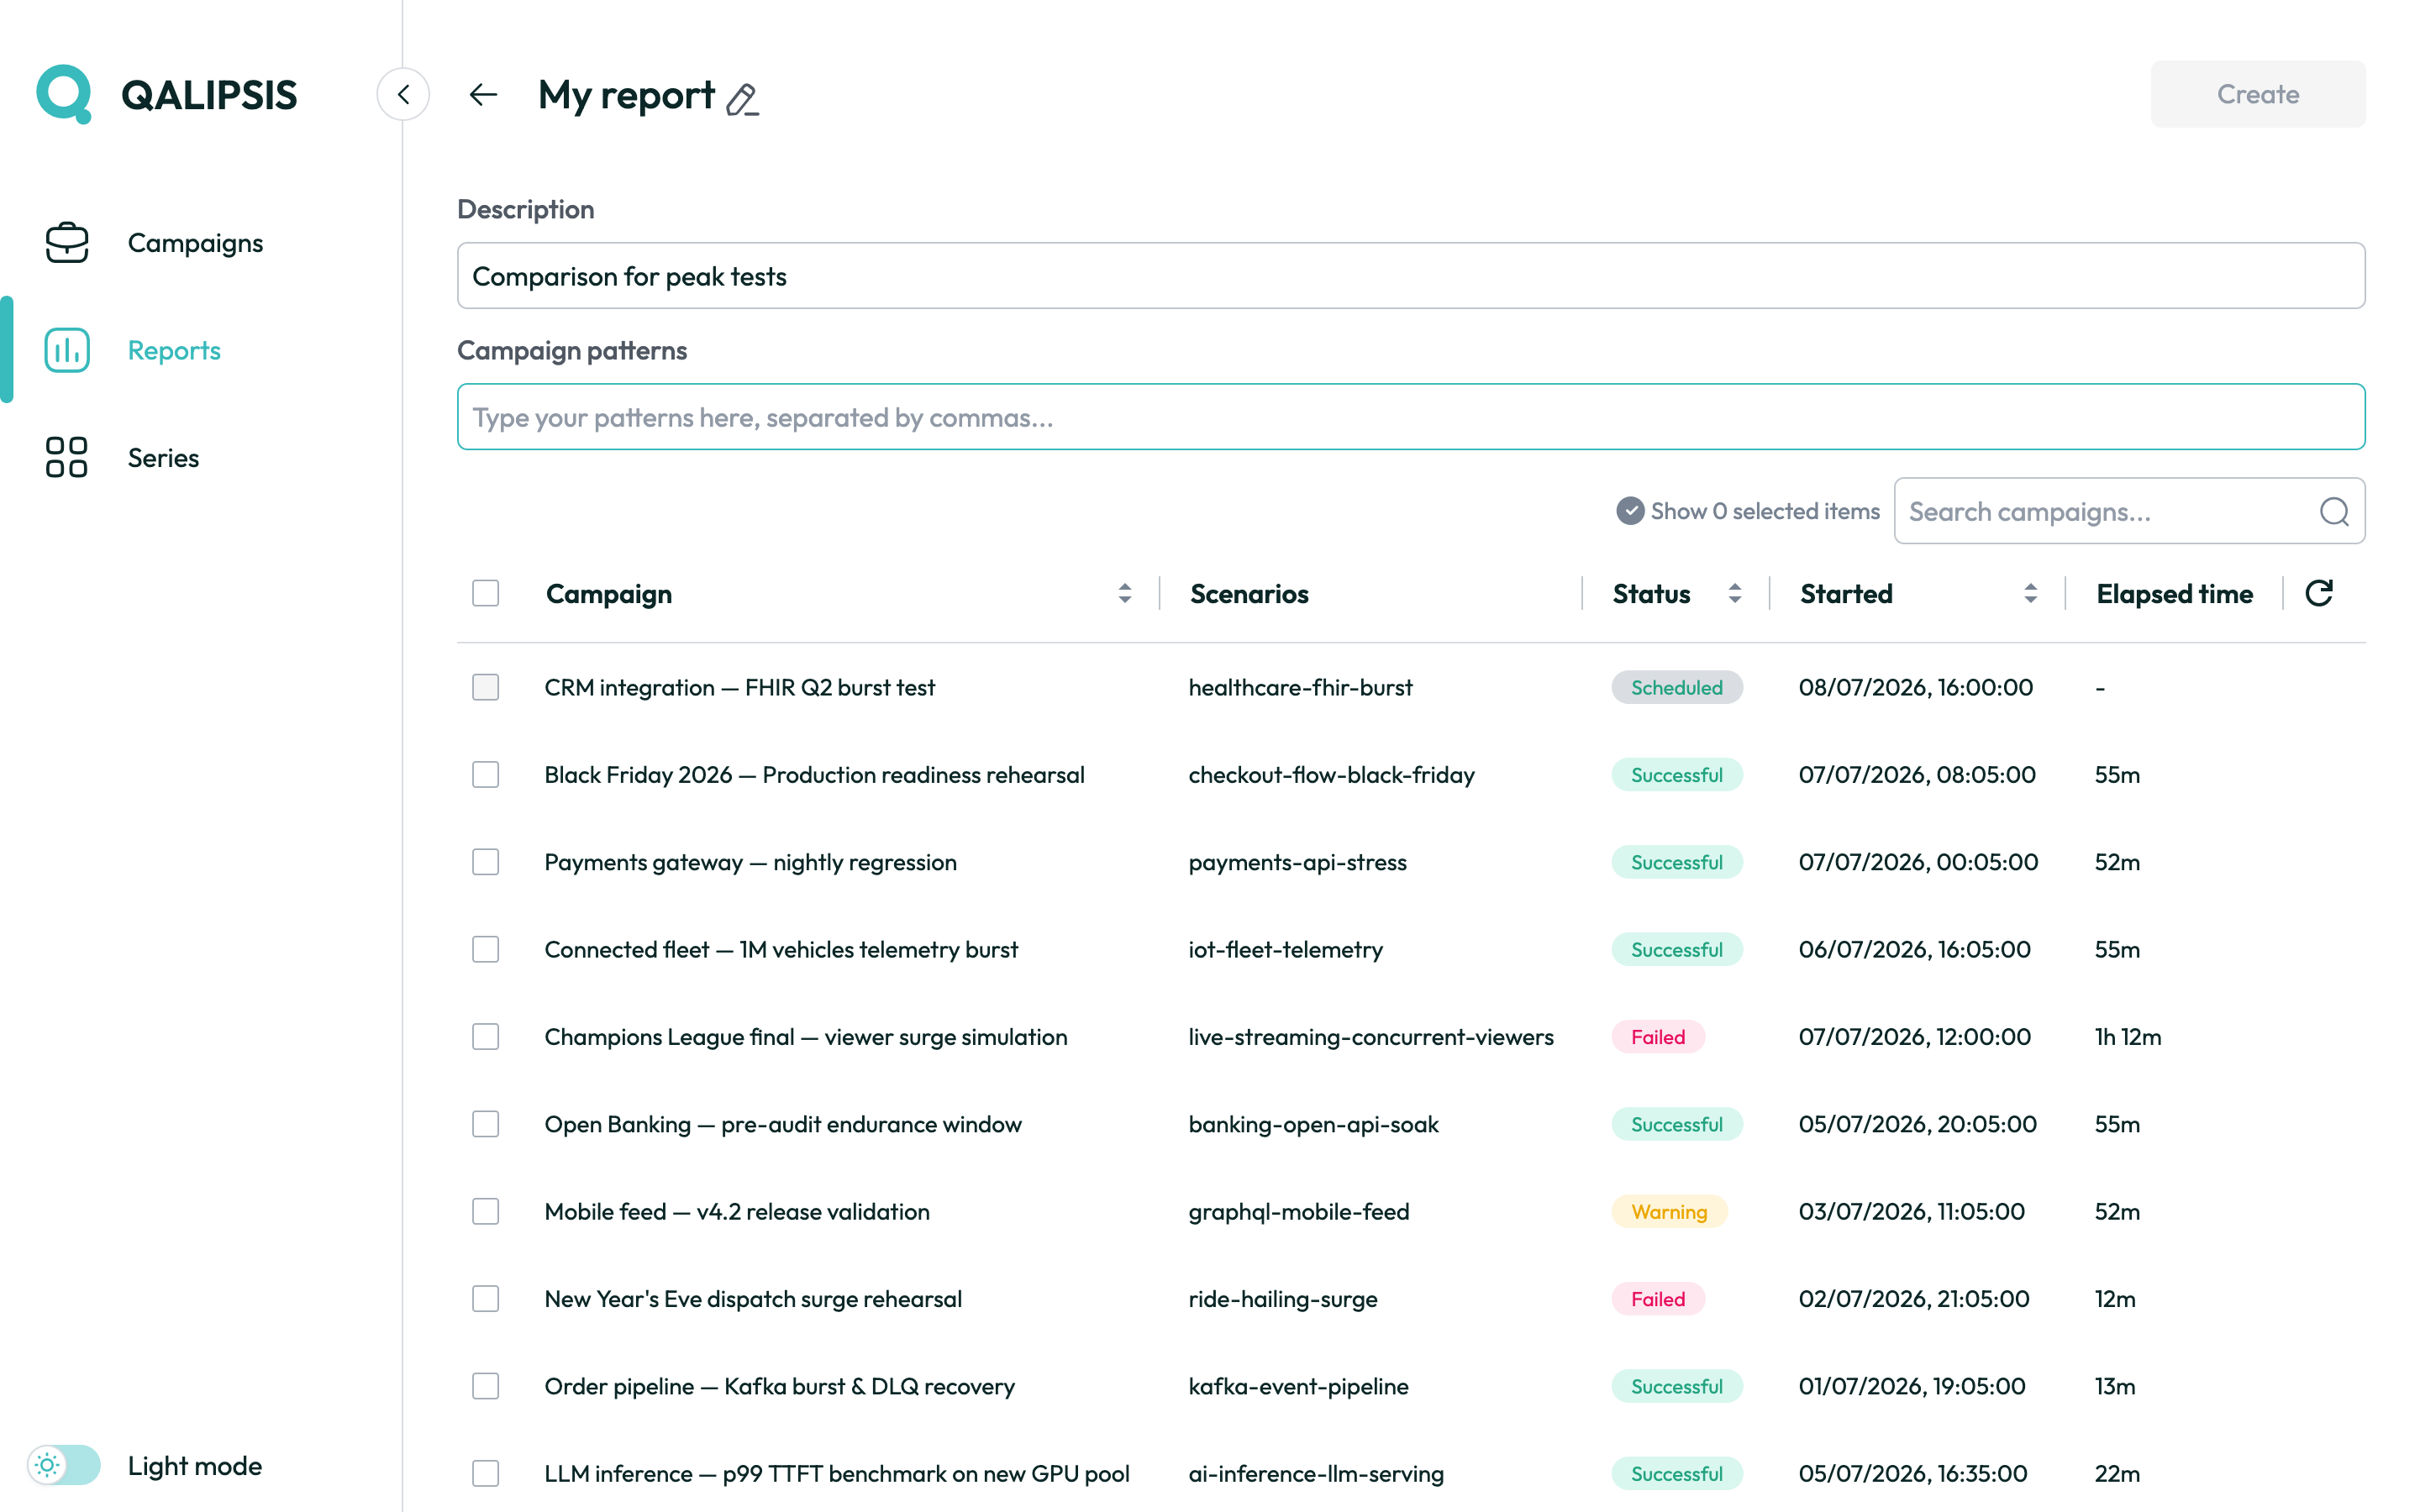
The creation form collects:
-
A display name and a longer description.
-
A list of campaigns — select campaigns individually, or define a pattern matched against the campaign names. The included campaigns are resolved at generation time from the selected filters, so a dynamic pattern always includes the 10 most recent matching campaigns.
-
One or more data components:
-
DIAGRAM— line chart. Accepts several series and stacks them on the same time axis. -
DATA_TABLE— tabular listing of the aggregated values.
-
A report cannot be created without at least one series in the tenant — see Series first.
Report details
Opening an existing report displays the fully rendered layout together with the same edit form on the side:
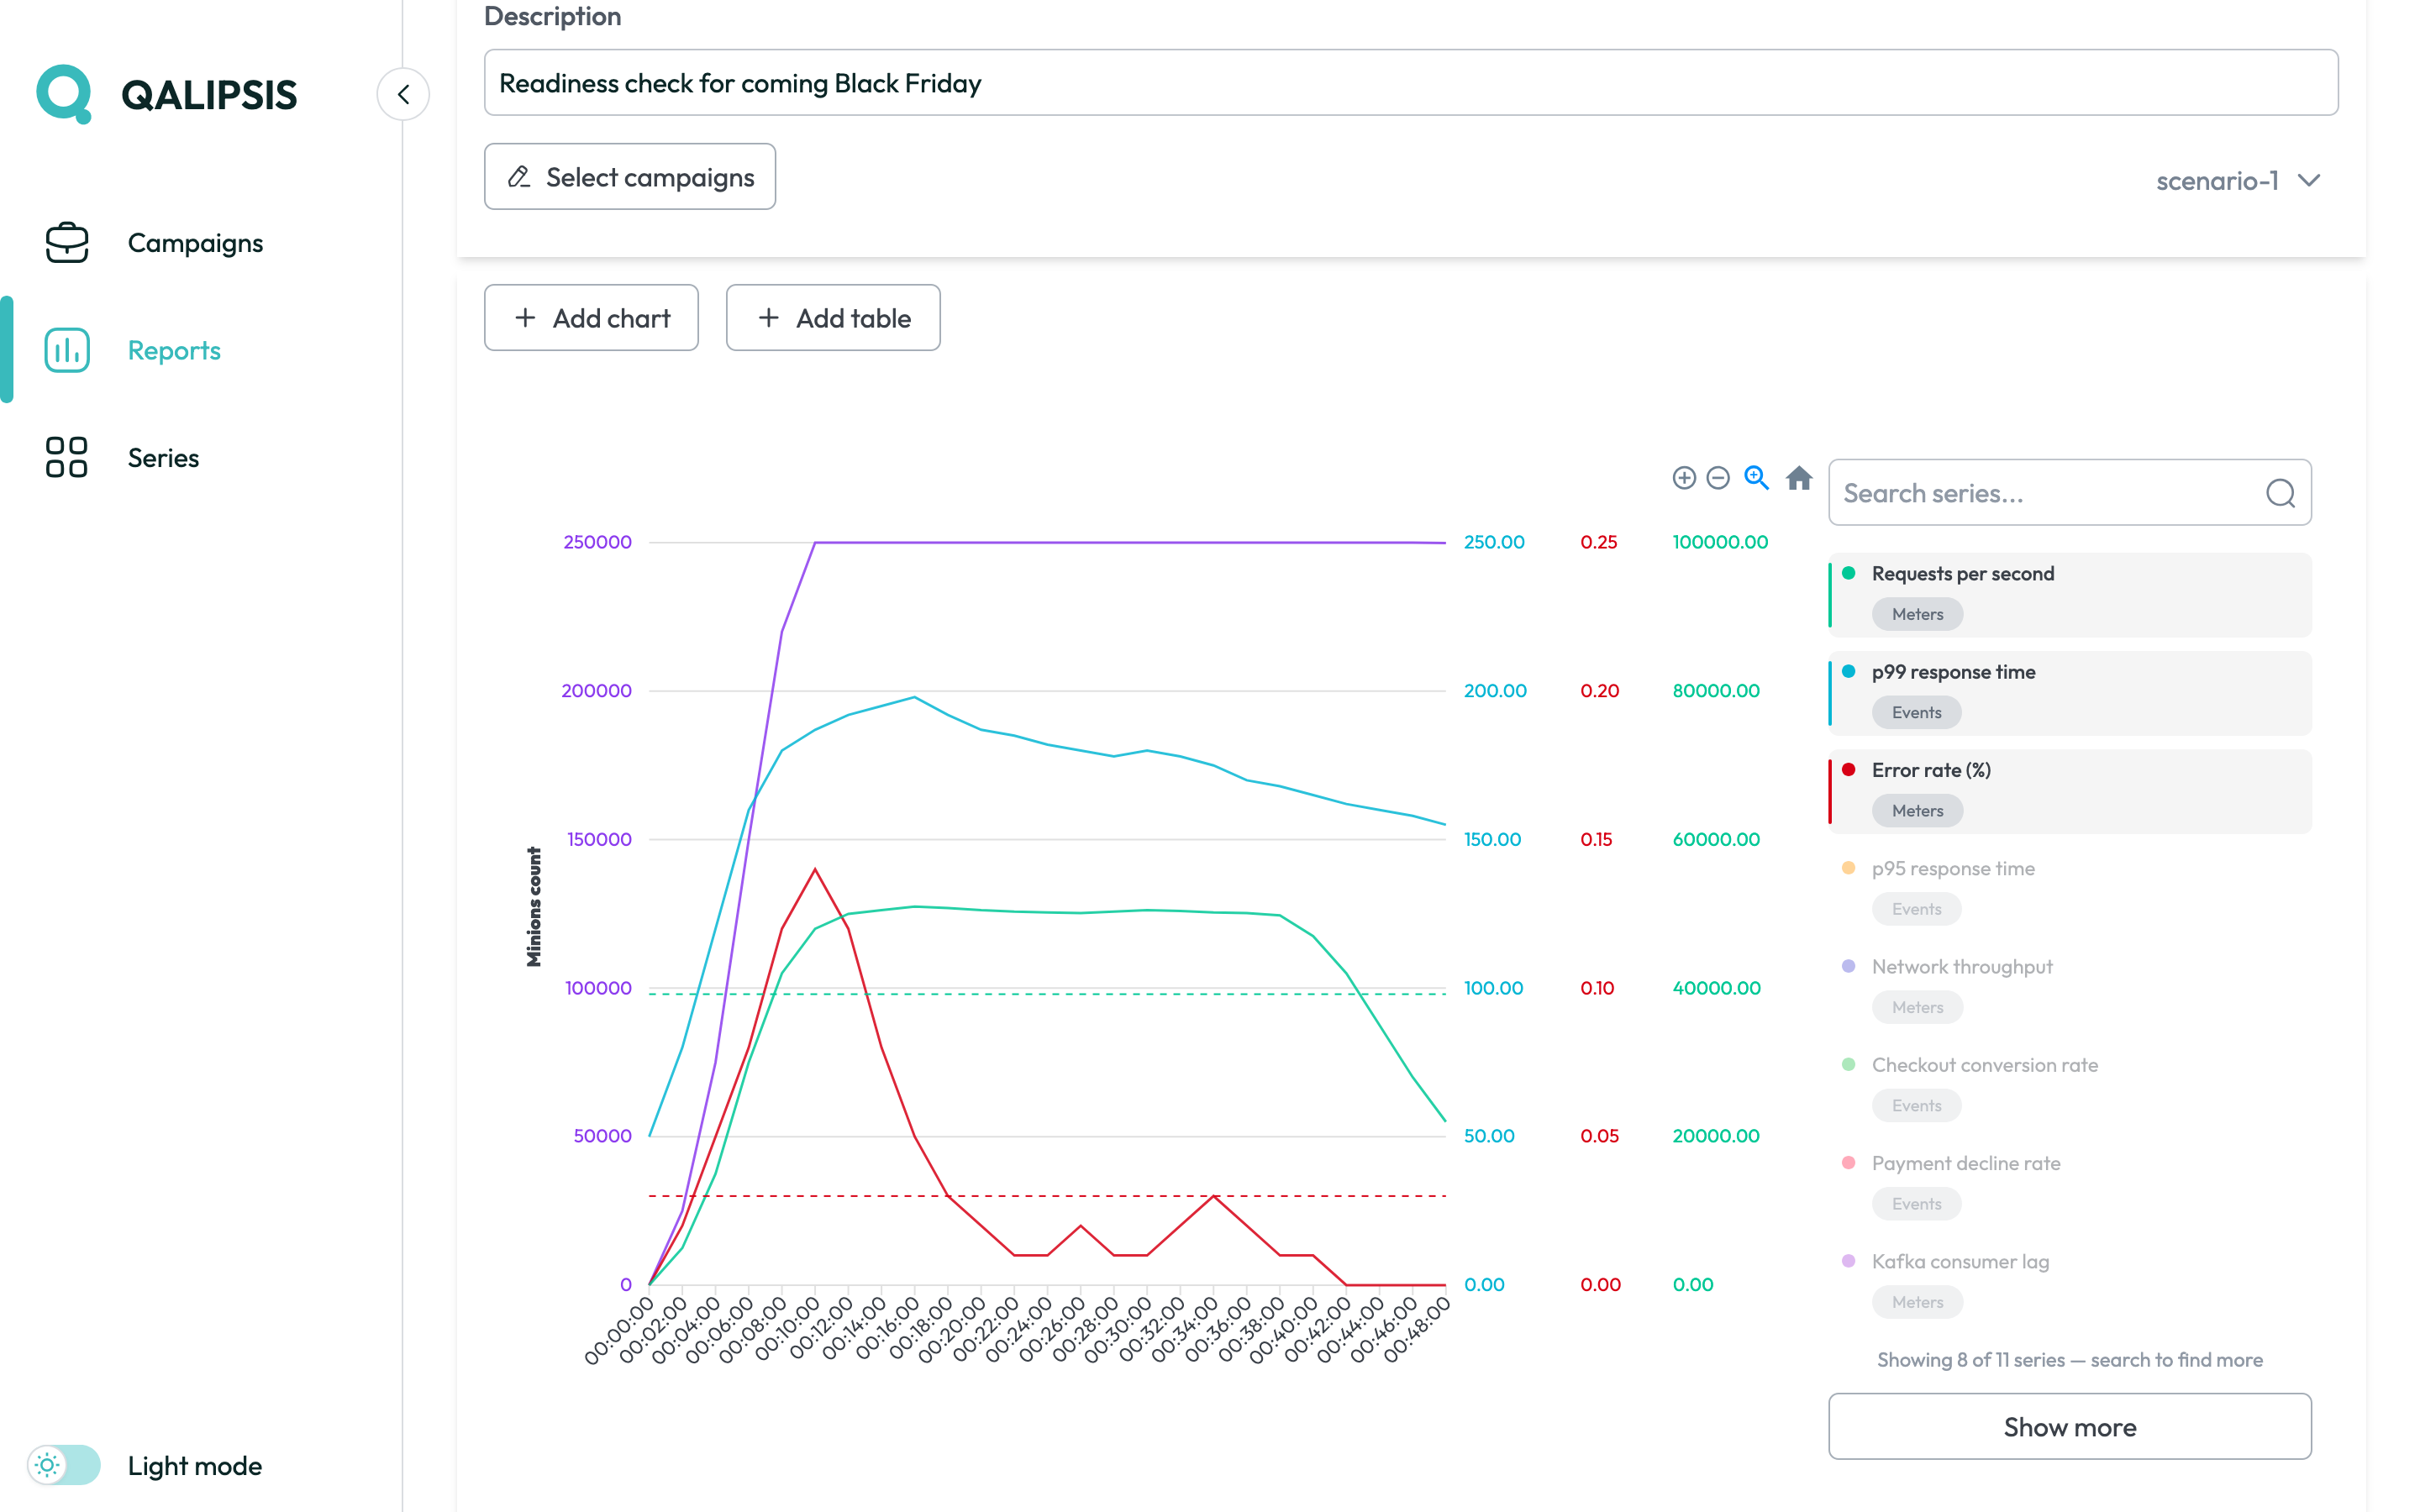
From here you can:
-
Adjust the campaigns and scenarios attached to the report.
-
Add, remove or reorder data components.
-
Export the report as PDF via the top-right button.
Changes are applied on save; the preview to the right refreshes with the new selection. The PDF export only reflects the saved configuration, so save before exporting.