Series
Series list
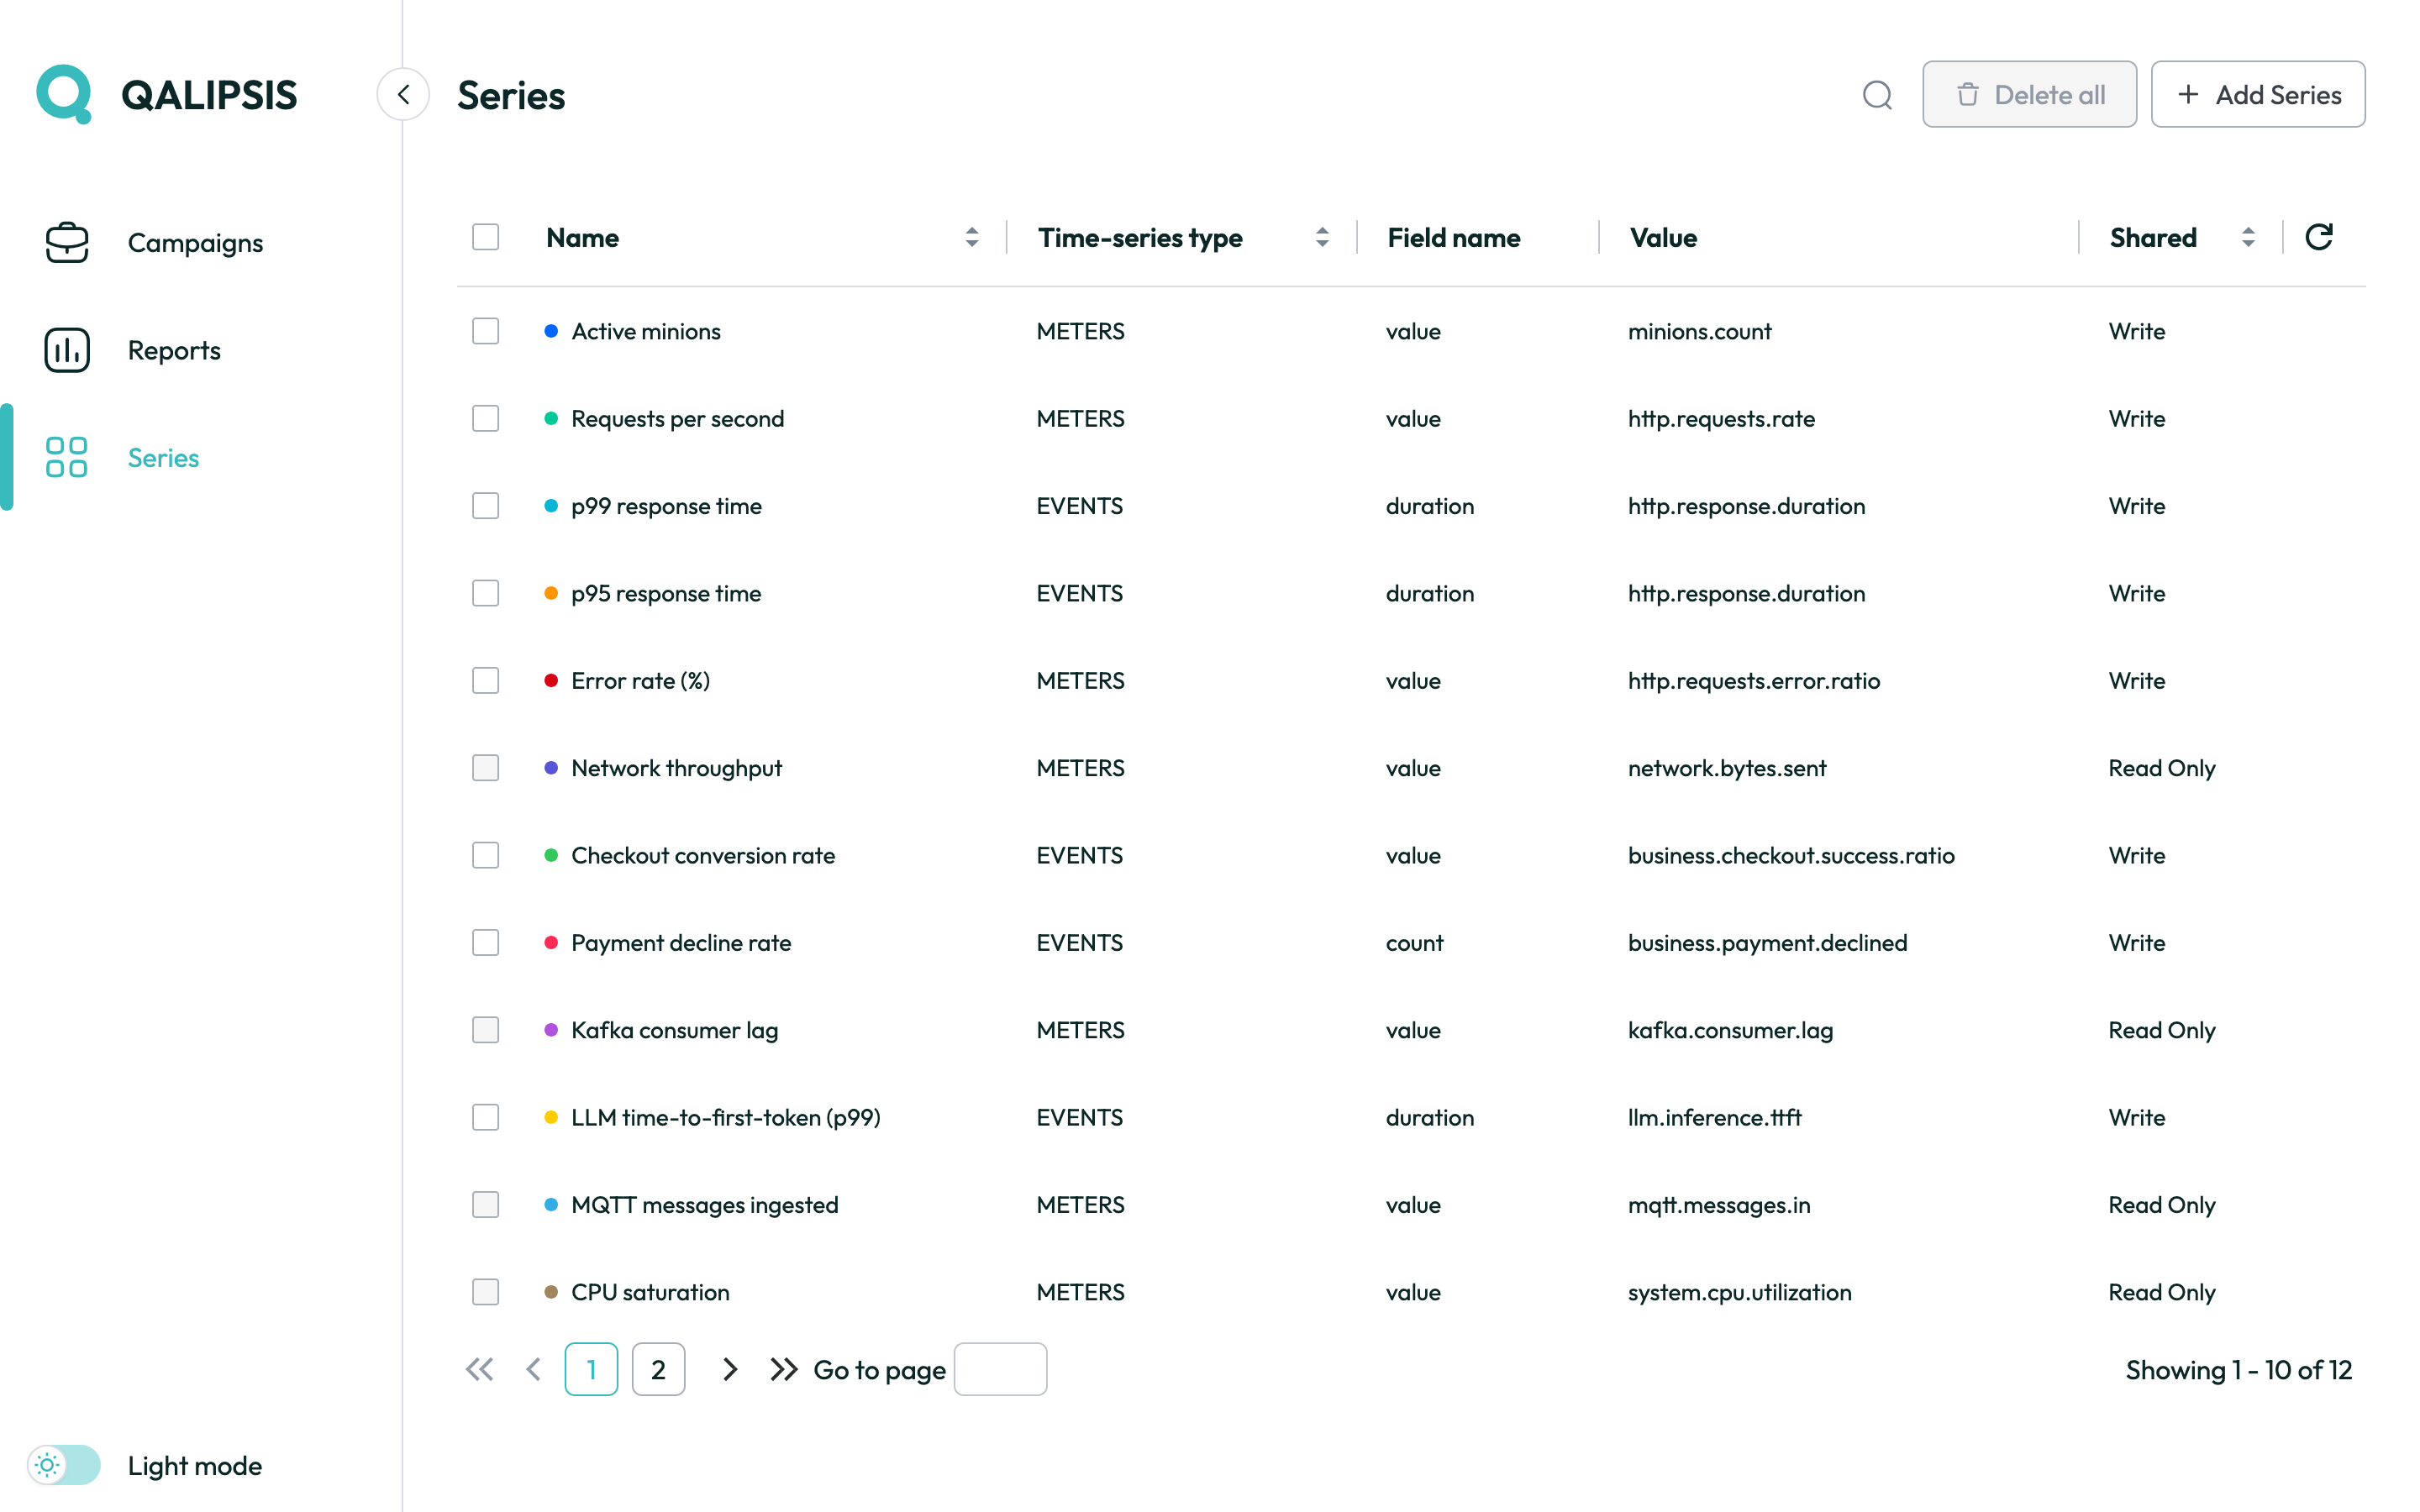
Each row shows:
-
Display name — human-readable label used on charts.
-
Data type —
METERS(numeric aggregated measurements) orEVENTS(discrete occurrences, attached to individual minions). -
Field name — the metric or event field to be visualized.
-
Value name — the source metric or event key sampled from QALIPSIS.
-
Aggregation —
COUNT,AVERAGE,SUM,MIN,MAX,PERCENTILE_75,PERCENTILE_99, … Meters cannot be aggregated, as they are already aggregations. -
Sharing mode —
NONE,READorWRITE. Controls whether other users in the tenant can see and edit the series. Only relevant for the commercial edition and above.
Column headers are sortable and the search input filters by owner, display name and value name.
Click a row to view its details, and to edit it if you have the necessary permissions. Hovering a row reveals the button for its contextual menu.
Creating or editing a series
Both actions open the same modal dialog:
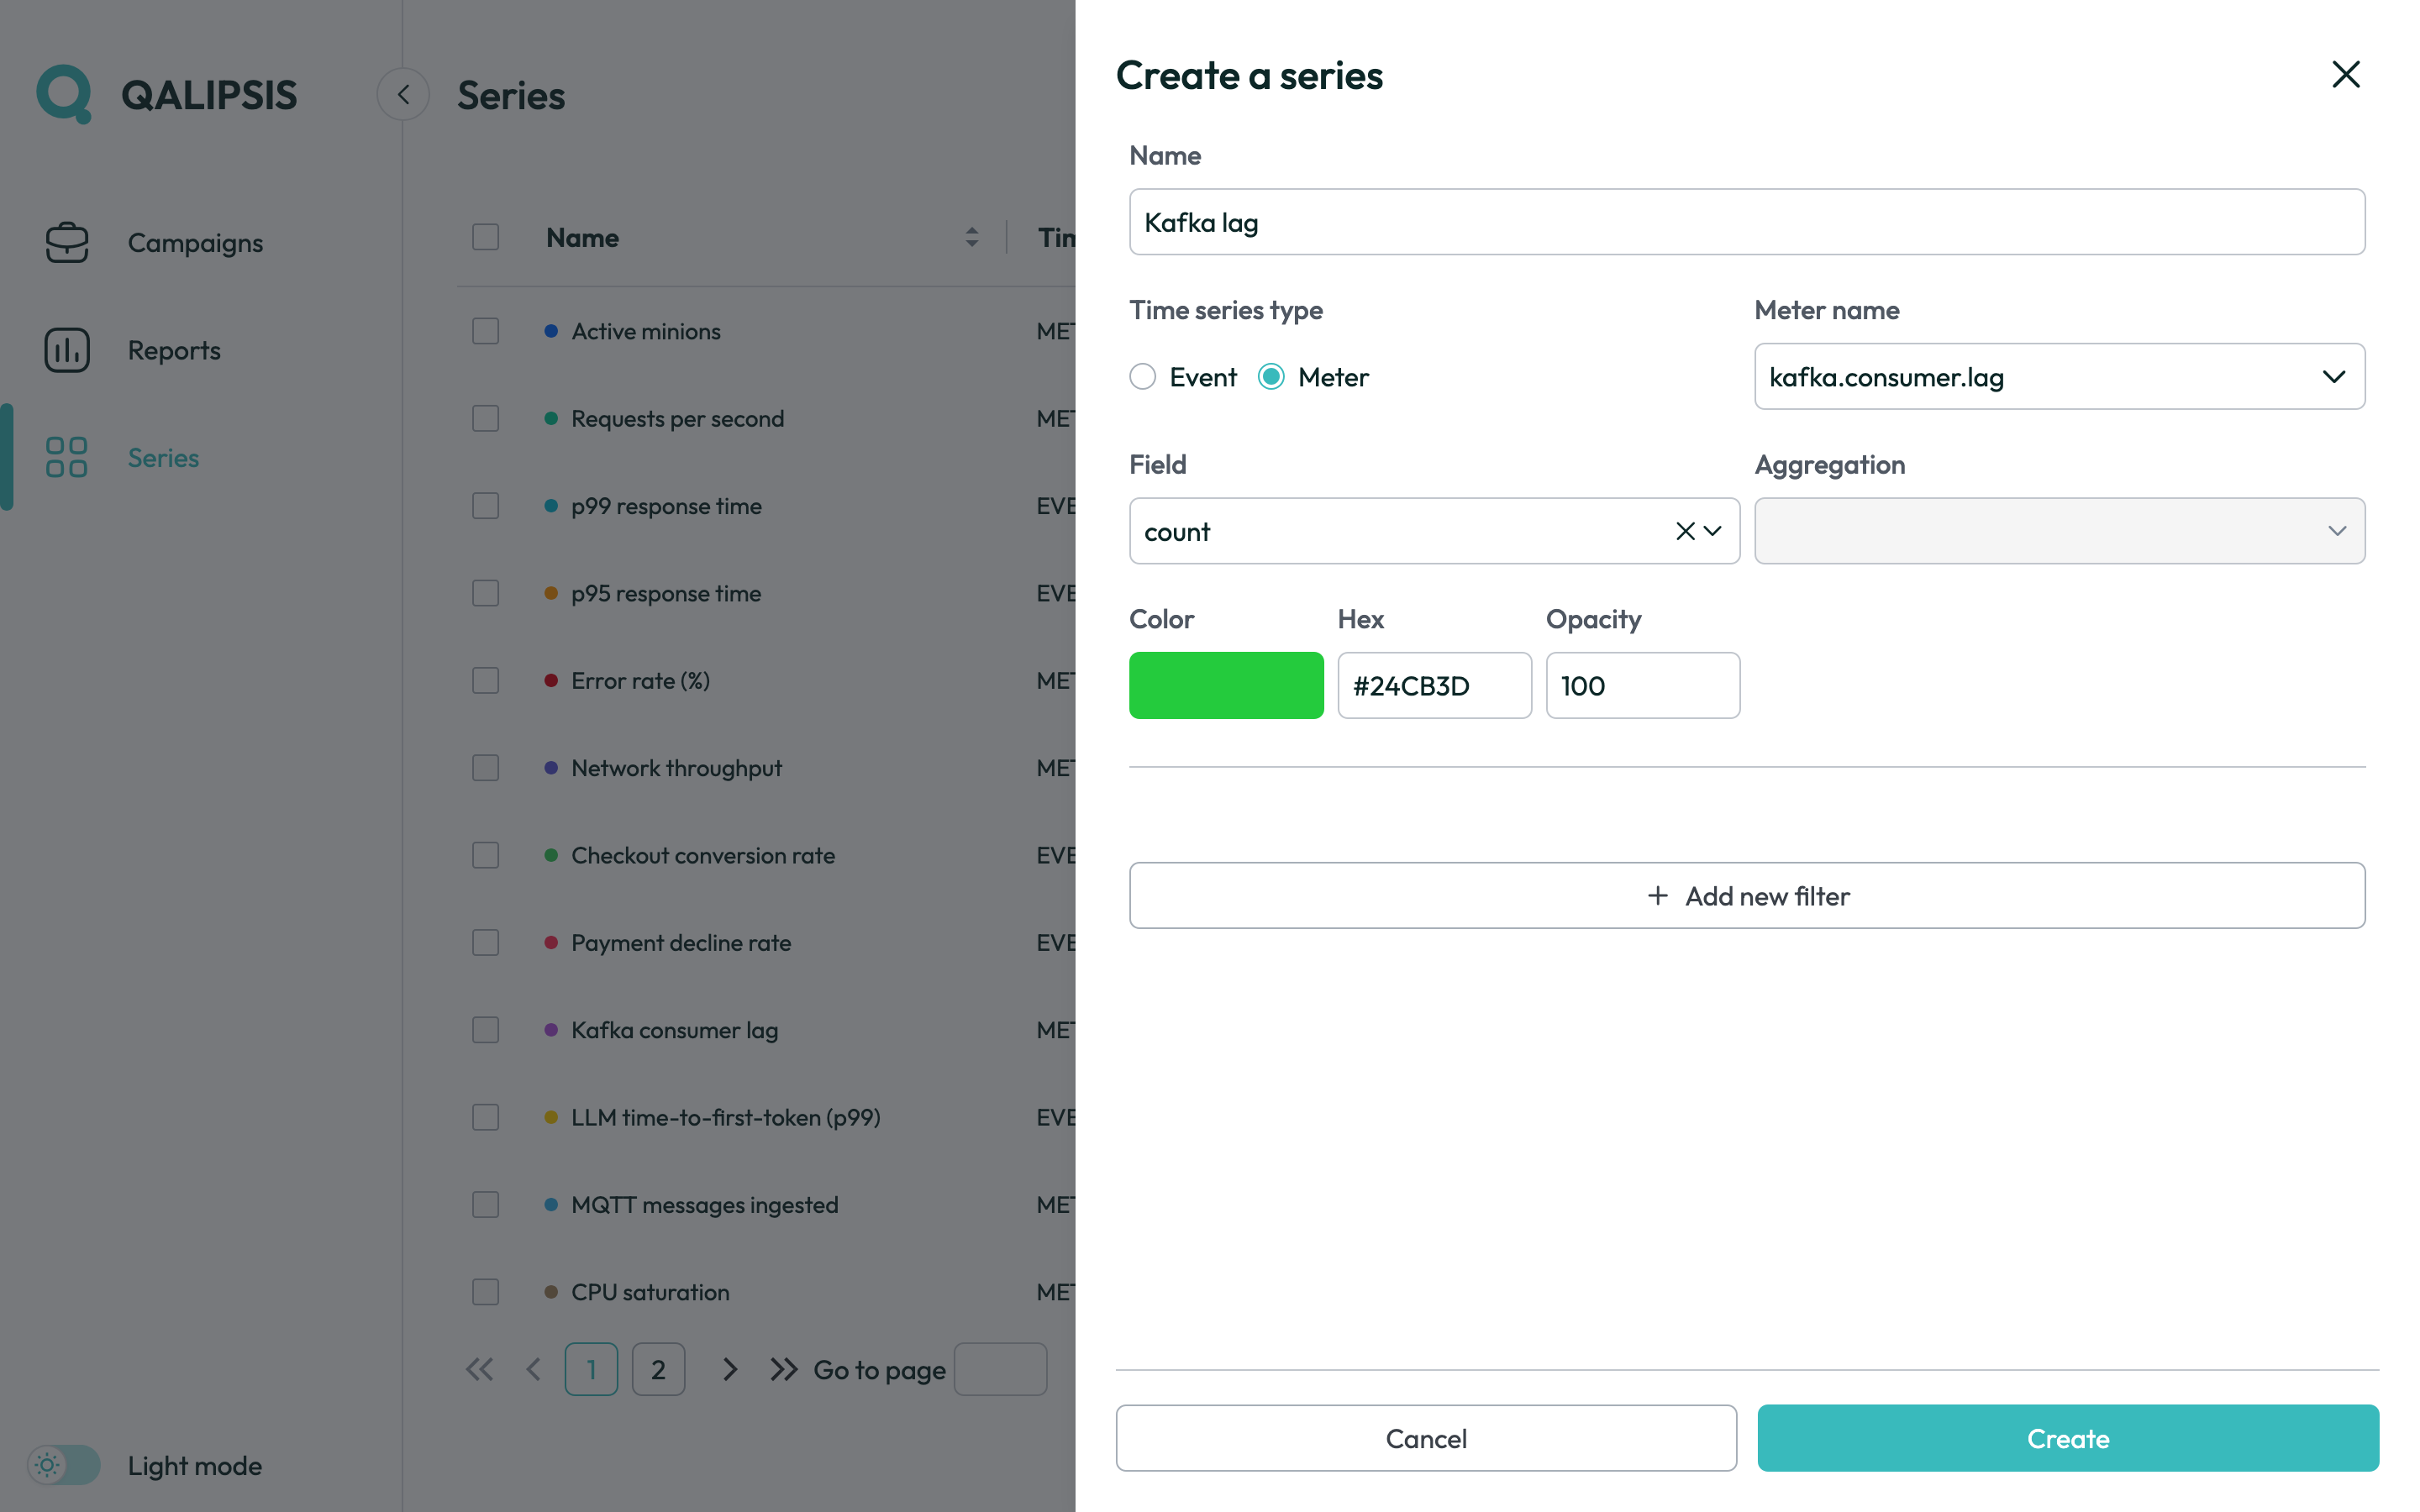
The form collects:
-
A display name.
-
The data type, which drives the list of available aggregations.
-
The value name — the metric key to read.
-
The field name — the metric or event field to be visualized.
-
The aggregation operation applied over the time buckets — relevant for events only.
-
Optional filters on tags to narrow the source dataset — some meters carry additional metadata in their tags while sharing the same key name.
-
A colour to render the series on charts.
-
The sharing mode — for the commercial edition and above only.
After saving the form, the new (or updated) series appears in the list immediately. Series that are referenced by at least one report cannot be deleted — the delete action returns an explanatory error.
Why create series before reports
A report is a composition of one or more series over a set of campaigns. Attempting to build a report without existing series leads to an empty configuration screen. The recommended workflow is therefore:
-
Run the campaigns that produce the underlying measurements.
-
In the campaign details screen, identify the metrics you can visualize and the aggregation level you want to observe.
-
Define the series that expose those measurements at that aggregation level.
-
Assemble one or more series into a report.