Reporting
Reporting the test results is essential for understanding the performance and behavior of your tests. QALIPSIS provides several options for reporting and sharing.
|
To learn how to create and download reports in the GUI, refer to the related section in the GUI documentation. |
Default reporting
When the tests are executed, QALIPSIS generates a default report that includes the test results, execution time, and any errors encountered during the tests. It provides basic insights into the test execution.
When the data storage is enabled, the reports are persisted into the database and can be accessed later for analysis.
Note that the reports do not contain any analytics information and only reflect the overall state of the tests.
You can access the reports via the GUI or REST API.
-
GET /api/campaigns?sort=creation:desc: will return the list of campaigns ordered by their creation date descending. -
GET /api/campaigns/{campaign-key}: will return the details of a specific campaign, including its test results and messages.
You can learn more from the REST API documentation.
Live reporting in standalone mode
When the tests are executed in standalone mode, QALIPSIS provides live reporting capabilities. This means that you can see the test results and progress in real-time as the tests are running. Live reporting is particularly useful for monitoring long-running tests and quickly identifying any issues that may arise during execution.
This report is only available in standalone mode and enabled by default. You can disable it by setting the following configuration property: report.export.console-live.enabled: false.
It is encouraged to disable the live report when running tests in a CI/CD pipeline because this might generate errors when executing in a headless environment.
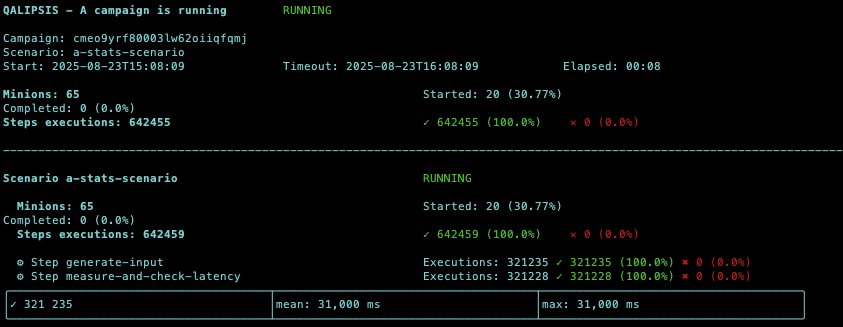
In the example above, you can read the overall metrics of the campaign, then the detail by scenario of the successful and failed operations, as well as the published metrics of each step, when enabled.
The counts in green represent successful operations, while the counts in red represent failed operations.
Plain text report
At the end of the test execution, QALIPSIS generates a final report in the console. This report summarizes the test results, including the number of passed and failed steps, execution time, published metrics and any errors encountered. The console final report provides a quick overview of the test execution and is useful for identifying any issues that need to be addressed.
This report is only available in standalone mode and disabled by default. You can enable it by setting the following configuration property: report.export.console.enabled: true.
Alternatively or additionally, the report can also be generated as a file by setting the configuration property report.export.console.folder to a folder that will contain one text file per executed campaign.
|
When a QALIPSIS local run task is executed, text reports are automatically created by the QALIPSIS Gradle plugin into the folder |
HTML report
QALIPSIS can generate HTML reports that provide a structured, interactive view of the test execution, including detailed results and published metrics.
The HTML report can be enabled by setting the configuration property report.export.html.enabled: true, and the output location can be defined by setting report.export.html.folder to a folder that will contain one HTML file per executed campaign.
In the GUI, the HTML report is accessible from the details page of a specific campaign. A download button is available in the top-right corner of the page to retrieve the HTML report of the displayed campaign.
|
When a QALIPSIS local run task is executed, HTML reports are automatically created by the QALIPSIS Gradle plugin into the folder |
JUnit report
To facilitate the integration with CI/CD pipelines, QALIPSIS can generate JUnit reports that are compatible with most CI/CD tools. These reports provide a standardized format for test results, making it easier to integrate QALIPSIS tests into existing CI/CD workflows.
Each step is reported as a single test case, and each scenario as a test suite.
The JUnit report contains the result of each step, including any errors encountered during execution as well as the published metrics.
The JUnit report can be enabled by setting the configuration property report.export.junit.enabled: true, and the output location can be defined by setting report.export.junit.folder to a folder that will contain one JUnit file per executed campaign.
|
When a QALIPSIS local run task is executed, JUnit reports are automatically created by the QALIPSIS Gradle plugin into the folder |